What exactly is a Monte Carlo simulation?
The Monte Carlo method is a stochastic simulation technique that uses computational tools to generate the final outcome of a given experiment; the resulting numerical characteristics are then recorded and evaluated. The error in the result is determined by calculating the standard deviation.
The method was developed by Stanislaw Ulam (with the collaboration of Ede Teller and ) in Los Alamos. Its applications now extend to nearly every scientific discipline.
In the context of crypto trading, Monte Carlo simulation provides us with a quantitative framework that allows us to assess various risks and price changes, and to optimize trading parameters without having to rely on simple assumptions.

How can it be used in crypto trading?
Use case 1: Predicting price probabilities
One of the most direct applications is using the algorithm to calculate the probability that the price of a given asset will reach a specific price point within a specific time frame.
First, historical log returns are calculated from the most recent price data. For each bar (candlestick),
the log return is calculated as ln(close_t / close_t-1). These returns can be categorized as positive (green) or negative (red) price movements.
Our simulation then generates random sequences at each step, and the model randomly calculates the expected return value based on the historical data. The program performs this thousands of times to calculate the possible price paths.
From this dataset, the model ultimately calculates the exact probability that a specific price level (e.g., 20% above the current price) occurred a certain number of times out of these many simulations, thereby providing us with probability data.
Use case 2. We can calculate the probability if the price will reach our stop-loss and take-profit levels first.
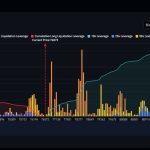
The Macro Monte Carlo 10000 Prob indicator, available on TradingView, uses this complex approach, which was specifically designed for this purpose. This can be extremely useful.
After the program generates thousands of potential scenarios, the indicator calculates the percentage of cases in which the price reached the take profit or stop loss level.
This directly answers an important question in crypto trading: “What are the odds that the price will hit my stop loss before my take profit?” For example, in 1,000 simulations, it might show that the price hit the stop-loss first 600 times, which is 60% of the total amount. Obviously, we want to achieve a result where this percentage is as low as possible, so that our trades aren’t closed down prematurely.
Other use cases
In addition, it can be used for portfolio risk management and a whole host of other things, such as betting on prediction markets such as Polymarket; in fact, bookmakers themselves use it to set odds.
So how can it be used for day trading?
Fortunately, the well-known TradingView platform includes several such free scripts.
“Monte Carlo Price Probabilities” by The_Peaceful_Lizard
“Macro Monte Carlo 10000 Prob with Bootstrap” by Wongsakon Khaisaeng
The practical limitations of the method and what to keep in mind
Monte Carlo simulation is not suitable for predicting the direction of price movements. Instead, it provides a statistical framework based on historical data.
Therefore, Monte Carlo should be used in combination with traditional technical indicators, making it an extremely useful tool for risk management and setting up the right trade setup. For example, the RSI or Moving Average indicator shows us a good opportunity to enter a trade. However, with Monte Carlo, we can calculate exactly under what parameters it is worth doing so.
Related posts:
 Crypto Slang – 10 Phrases You Should Know
 Bitcoin Liquidation Map – The Ultimate Guide
 Rising Wedge Pattern – What Is It, And How Do You Trade Using It?
 Bitcoin Strategic Reserve – Everything You Need to Know (2026)
 Monero (XMR): Everything You Need to Know (2026)
 Doji Patterns in Technical Analysis – The Ultimate Guide