If you have ever been in a situation where you saw an asset rising, which then suddenly noticeably drops, then it may have been the Rising Wedge pattern. This is one of the most reliable chart patterns in technical analysis, but many novice traders simply either don’t notice it or trade it incorrectly.
Our goal with this article is to teach you what a Rising Wedge is, how it forms, and most importantly, how to trade it correctly.
What is a Rising Wedge?
Imagine a staircase with slightly lower steps as you’re walking up. This is a Rising Wedge.
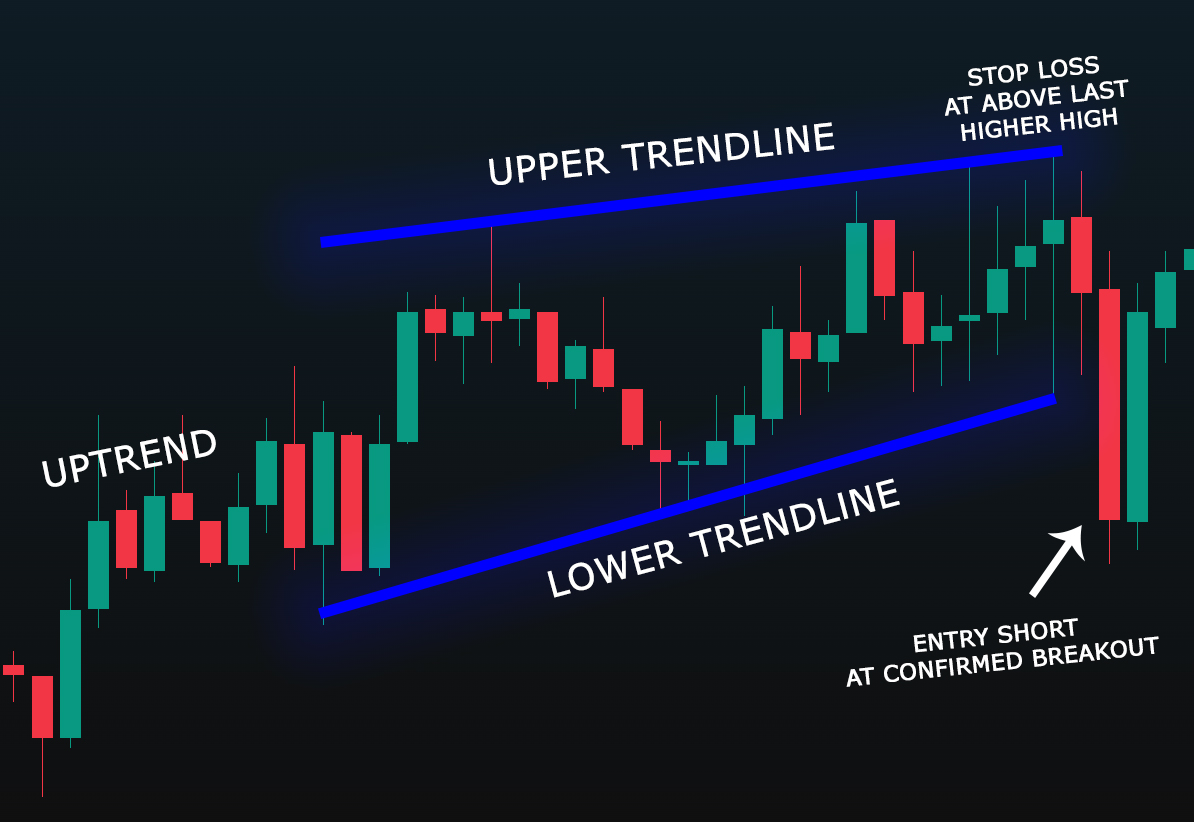
This is technically a bearish reversal pattern, which occurs when the price generates higher highs and higher lows. When you connect these with trendlines, the wedge figure is drawn upwards.
Key Characteristics:
Upper trendline: Connects at least two higher highs
Lower trendline: Connects at least two higher lows
Volume: Usually decreases as the wedge forms
Breakout: The price breaks down from the lower trendline
For example, imagine a car that gradually runs out of power when going up a hill and its performance decreases, or a runner runs out of energy, and eventually stops. The Rising Wedge pattern is similar.
Why does a Rising Wedge form?
Buyers push the price up, but the rallies get weaker and weaker, so eventually demand exhausts itself and supply overwhelms it, ultimately producing a drop.
How to Trade When You Spot a Rising Wedge Pattern
Step One: Wait for the breakout.
Wait for the price to close below the lower trendline. Not just a wick, but the price actually closes there, which confirms the breakdown.
Step Two: Set your stop loss
Set your stop loss just a little above the last higher high inside the wedge. Or you can even use the upper trendline.
Why? If the price breaks down but then reverses and breaks above the wedge, the pattern is invalid.
Step Three: Set your price targets
The most common method is to measure the widest part of the wedge. Subtract this distance from the breakdown point to calculate the price target.
An example of a real trade (simplified)
Imagine a crypto like (ExampleCoin) or it can be an imaginery stock like (ExampleCompany) 🙂
– Uptrend from about $60 to $80
– Forms a wedge with highs at $64, 68, 71, and lows at 56, 60, 64
– Volume falls back over 7 days
– Price closes above support
– You open a short position at 64
Price drops to $55 over 5 days. You close with a 16.36% profit.
Related posts:
 Is Monte Carlo Simulation useful for Crypto Trading?
 Bitcoin Liquidation Map – The Ultimate Guide
 Double Bottom Pattern – The Ultimate Trading Guide
 Relative Strength Index: The Ultimate Guide for Beginners
 Doji Patterns in Technical Analysis – The Ultimate Guide
 Monero (XMR): Everything You Need to Know (2026)