If you’ve ever looked at a trading chart, you’ve probably seen it. It’s a wavy, usually blue line that always represents a value. This simple and at first glance boring chart is the Relative Strength Index (RSI). It’s one of the most powerful tools in a day trader’s arsenal.
It won’t tell you whether Bitcoin, Tesla, or Ethereum is a good asset. It will tell you something much more specific, like whether the crowd is really excited about an asset or if they’re panicking.
Let’s solve this mystery.
The essence of RSI.
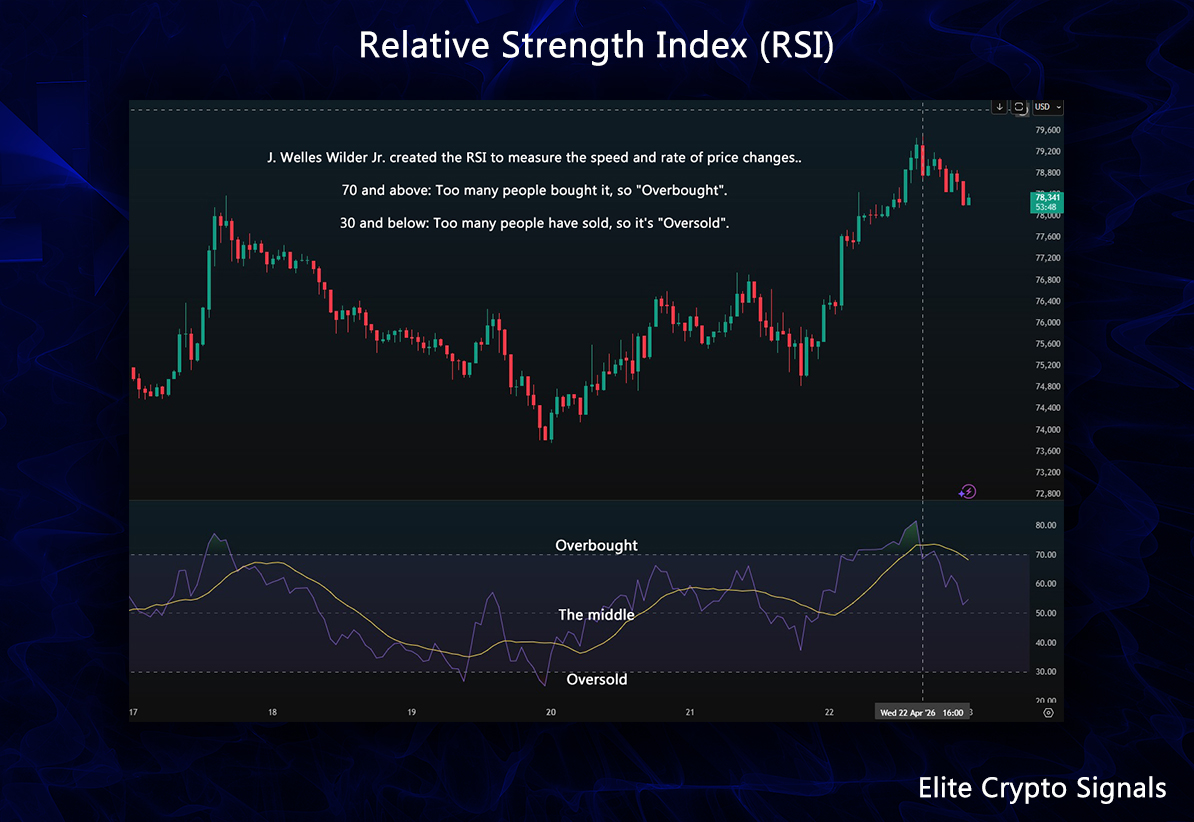
J. Welles Wilder Jr. created the RSI to measure the rate of change and speed of price changes. It’s a spectrum that runs from 0 to 100.
70 and above: Too many people bought it, so “Overbought”.
30 and below: Too many people have sold, so it’s “Oversold”.
The most important thing is that when everyone has bought something, no more people can buy it, since the number of traders is not infinite. At this point, the price usually falls at one point, i.e. “the balloon bursts”. However, if everyone panicked and sold, then there was too much selling and there are no more people who can sell it. At this point, the price usually starts to increase. Of course, this is not always the case, but this way you can understand the concept behind RSI.
For example, imagine an Ariana Grande concert. Ariana starts singing. The audience cheers. The cheers get louder and louder, but sooner or later the crowd gets tired and can’t cheer any louder, they run out of air, and it is quite likely that the cheers will decrease. At this point, if we had the opportunity to short, it could have earn us quite a lot of money :).

How to interpret the RSI, or the 3 important zones.
First zone: Overbought (70+)
Signal: In this case, it is worth selling or at least not buying anymore
If the RSI has already risen above 70, then buyers will soon run out of steam. Many people fall into the FOMO trap at this time, and this is where many beginners and even experienced traders fail.
Second zone: Oversold (30 or below)
Signal: In this case, it is worth taking advantage of the opportunities, if any.
If the RSI has already fallen below 30, then the product is underpriced. At this time, “smart” money usually starts to flow into the project.
Third zone: The middle place (50)
Signal: This is the trendline.
In this case, neither buyers nor sellers have control.
If it were to go above or below 50, then either buyers or sellers would gain control over the price.
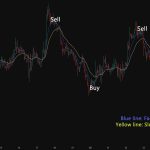
How to use it?
You can go to Tradingview, load up a simple RSI Indicator, and can immediately see if a crypto is oversold or overbought.
The professional method: Divergence
Beginners just look at the RSI, but professional traders also prefer to rely on Divergence, but what is that? We can talk about Divergence when the RSI and the price show completely different things and do not “understand” each other.
Bullish divergence (one of the best buying indicators)
The price goes down to a new bottom (lower low).
The RSI, on the other hand, reaches a higher low.
So, even though the price is falling, according to the indicator, we cannot talk about exhaustion, and a reversal is likely.
Bearish Divergence (one of the best selling indicators).
The same thing, only in reverse.
The price is making a higher high (the price is going higher than ever before)
However, the RSI is making a lower high.
So even though the price is increasing, it’s actually starting to run out of buyers, and the reversal to downwards is likely to happen.
Not a “golden bullet”, but an extremely reliable indicator
Let’s add that the Relative Strength Index is a great indicator, but it is not a crystal ball. It cannot predict the price with 100% certainty. After all, other things can always happen, e.g. positive or negative news, and similar fundamental aspects, which can affect the price in a way that the RSI can no longer calculate in. However, among the strictly mathematically based indicators, we can talk about one of the best, which can be of great help to every day trader.
Related posts:
 Is Monte Carlo Simulation useful for Crypto Trading?
 Rising Wedge Pattern – What Is It, And How Do You Trade Using It?
 Moving Averages – Ultimate Guide
 Monero (XMR): Everything You Need to Know (2026)
 Doji Patterns in Technical Analysis – The Ultimate Guide
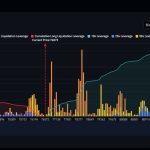 Bitcoin Liquidation Map – The Ultimate Guide