Doji is one of the most important candlestick patterns. It appears when an asset’s opening and closing prices are virtually the same, creating a cross-like pattern, and it shows indecision on the part of the traders. There are several variations, and they all have different indications for the market. Generally, Dojis signal either a reversal or a continuation, depending on the situation. Let’s take a look at the five most common variations.

1. Common Doji
Meaning: Pause or indecision
Bias: Neutral
This Doji features short body and small upper and lower wicks. It shows that the price fluctuated both above and below the opening price, but ultimately remained unchanged. This may occur after a strong uptrend or downtrend, and signals waning momentum. Therefore, it is essentially neutral. A subsequent candle is also needed to determine the final direction, whether a bullish or bearish breakout will ultimately occur.
2. Long-Legged Doji
Meaning: Powerful battle between bulls and bears
Bias: Neutral, but indicates potential reversal
We can also call it “rickshaw man.” This Doji has long upper and lower shadows and a small central body. It indicates extreme volatility and clear indecision. The price moved significantly higher and lower before the open. It shows that both buyers and sellers were active, causing significant price movement, but neither side was able to gain a lasting advantage. A long-legged Doji may signal a potential reversal after a parabolic rally. Confirmation by volume is recommended in such cases.
3. Dragonfly Doji
Meaning: Sellers pushed the price down, but buyers eventually reversed it
Bias: Bullish
It has a cool name, but what does it actually mean? It forms when the open, close, and high are largely the same, creating a longer shadow. It resembles the letter T and can signal a strong bullish reversal in a downtrend. It means that sellers pushed the price down early on, but buyers eventually overpowered them and pushed the price back up to the open, showing rejection at lower levels. It’s worth waiting for the next green candle, which will eventually close above the dragonfly’s high, thereby confirming the conclusion.
4. Four-Price Doji
Meaning: Low activity, indecision
Bias: Neutral
A fairly rare but significant Doji. This occurs when the open, high, low, and close are all largely similar. It signals complete paralysis. There is no price movement. This indicates total indecision in the market or a complete lack of liquidity. It has little significance in a low-volume market, but if it appears after a strong move, it clearly predicts a breakout.
5. Gravestone Doji
Meaning: Buyers initially pushed the price, but sellers rejected it
Bias: bearish
Also known as the Grave Doji. The opposite of the Dragonfly. This Doji has equal open, close, and low prices, and a long upper shadow. It resembles an inverted T or a cross (hence the name). It indicates strong selling pressure and a rejection of higher prices. It shows that buyers initially pushed the price higher, but sellers eventually drove it back down to the opening price. Thus, the upward momentum has failed.
Related posts:
 Is Monte Carlo Simulation useful for Crypto Trading?
 Relative Strength Index: The Ultimate Guide for Beginners
 Rising Wedge Pattern – What Is It, And How Do You Trade Using It?
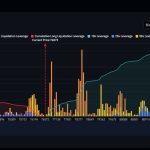 Bitcoin Liquidation Map – The Ultimate Guide
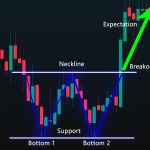 Double Bottom Pattern – The Ultimate Trading Guide
 Monero (XMR): Everything You Need to Know (2026)