The Double Bottom. Everything You Need to Know About This Powerful Reversal Pattern
If you’ve ever seen a price drop, then bounce back, then drop back to the same spot, then bounce back. Then you’ve probably seen the Double Bottom pattern. It’s one of the most reliable and popular bullish reversal patterns. It works in crypto, stocks, and more.
In this article, we’ll explain in detail but to the point what a Double Bottom is, how to trade it, and why it exists.
So what is a Double Bottom pattern?
A bullish chart looks like a W. It is formed when the price falls to the very first bottom, which is the support level, then turns back, then falls again, (that is the second bottom, and finally breaks out upwards.
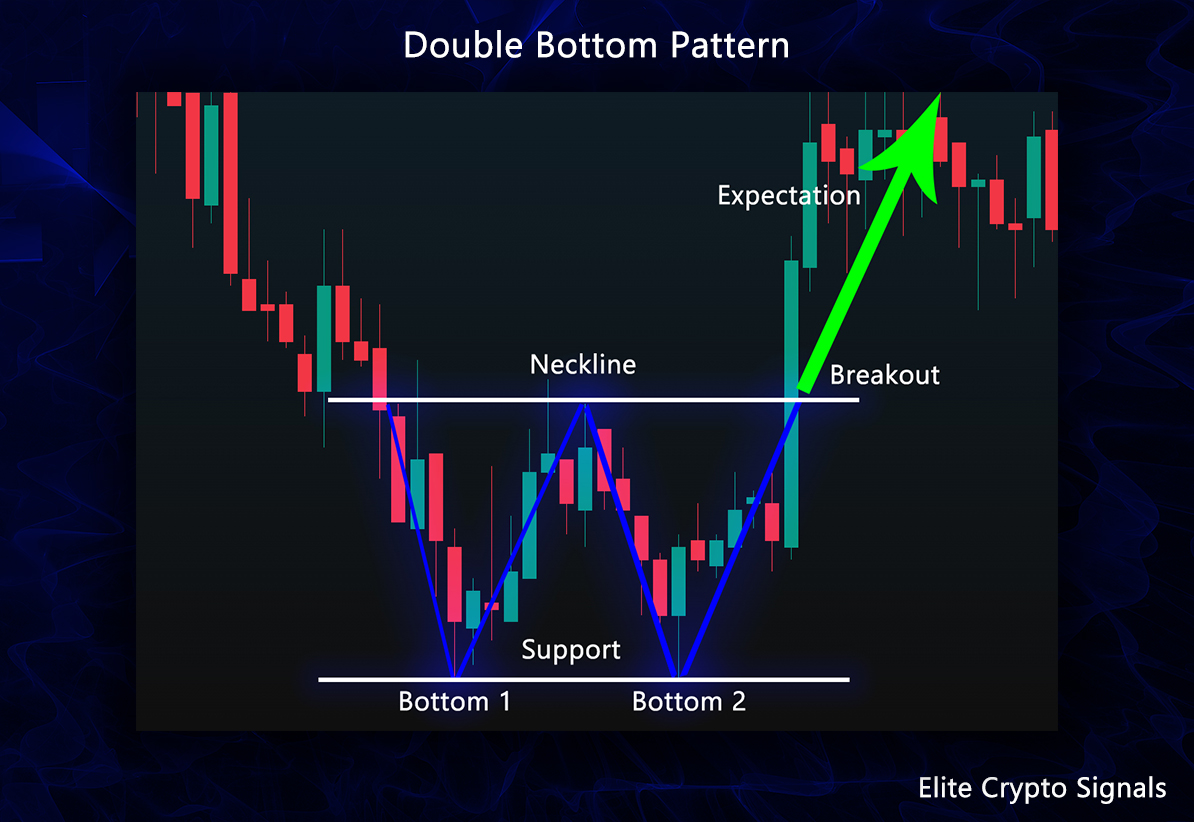
How to spot a Double Bottom
1. There is a clear downtrend before the chart (for several weeks or days)
2. There are two clear bottoms in the same pattern.
3. The middle peak (the difference in height between the two bottoms, which stands out in the chart.
How to trade using a Double Bottom
It is actually simple, like other trades. Entry, stop loss, profit take.
First step: Wait for the breakout to happen
Never buy on the second bar. Because the price may fall further and in the end it will not be a double bottom pattern, but an artificial one.
Wait for a candle to close above the middle peak. This can confirm that the bulls won.
Step Two: Start Trading
Once the breakout has been confirmed, we can open a Buy position. The right moment to enter is when the candle closes above the middle peak. Some traders tend to wait until there is a small pullback to support, but it is convenient and easy to enter immediately, especially for beginners.
Step Three: Set the stop loss.
This is a must, risk management 1.0. You need to look for the lowest point of the two lower points, the W shape.
If the price falls below this, then the pattern structure has collapsed, and this invalidates the trade.
Step Four: Set the Take Profit.
The classic method here is to measure the distance difference between the lowest bottom and the middle peak. For example, if the bottom is at $100 and the middle peak is at $140, then the target is $180.
Try to avoid these common mistakes!
Even the best traders can lose money if they make these mistakes. There may be psychological reasons for this, when even experienced traders can fall for it.
1. Buying at the second bottom: Although it can be promising, this should be avoided at all costs if you do not want to lose money.
2. Ignoring the downtrend. A double bottom means almost nothing without a clear downtrend before it. If it happens in connection with an uptrend, it is just unnecessary noise.
3. The bottoms are too far apart: If the two bottoms are more than 12-15% apart, then it is ruled out as a real double bottom.
4. If the stop loss is set too tight. This is also a mistake, because it can terminate the trade without being justified.
Let’s summarize it.
A double bottom is a useful gift for traders, because it shows a clear buying opportunity, with a clear reversal signal, and a stop loss, as well as a measurable target. But you have to be careful to trade correctly to minimize the risk of loss.
Related posts:
 What Do Hedge Funds Really Think of Technical Analysis?
 Doji Patterns in Technical Analysis – The Ultimate Guide
 Glamsterdam Milestones and New Leaders at Ethereum
 Rising Wedge Pattern – What Is It, And How Do You Trade Using It?
 Is Monte Carlo Simulation useful for Crypto Trading?