Moving averages are one of, if not the most, commonly used indicators. They are simple to use and easy to understand, and don’t require complex mathematical knowledge to help you. They are available in every charting tool and almost every trading platform.
While it won’t predict the future, it will show you important truths about the present. It will show you where the money is flowing, where the buyers are hiding, and when it’s time to exit a trade.
So what is a Moving Average?
A Moving Average essentially calculates the average closing price of an asset over a given period. As new data becomes available, older data is pushed out, which is why it’s called a “moving” indicator.
To use a simple analogy: Imagine you’re driving and your speedometer (current price) goes from 60 to 100, but your average speed for the past 10 minutes has only been 80 mph. A Moving Average smooths out the unnecessary noise so that you only see the important road, not every bump.
There are two main types of Moving Averages. One is the Simple MA and the other is the Exponential MA (EMA).
The Simple Moving Average is calculated by adding up the previous closing prices over a period and then dividing it by the number of times this sum is reached. This works great when long-term trends need to be identified.
The Exponential Moving Average, on the other hand, reduces lag by giving more weight to the most recent data, so it is better to use it for short-term trades.
How to trade using moving average?
Moving average crossover
A moving average crossover is one of the best-known and most frequently used trading signals in technical analysis. The essence of the method is that investors watch the intersection of two moving averages calculated over different time periods – typically a short and a longer period. When the short moving average crosses the longer moving average, price analysis can conclude that a trend reversal is imminent.
One of the best-known signals is the so-called golden cross, which occurs when the short-term moving average (for example, 50-day) crosses the long-term one (for example, 200-day).
This can be interpreted as a strong buy signal, as it indicates that the price may enter an upward trend. In contrast, a death cross occurs when a short moving average crosses below a longer moving average, which is typically a sell signal and indicates a weakening market.
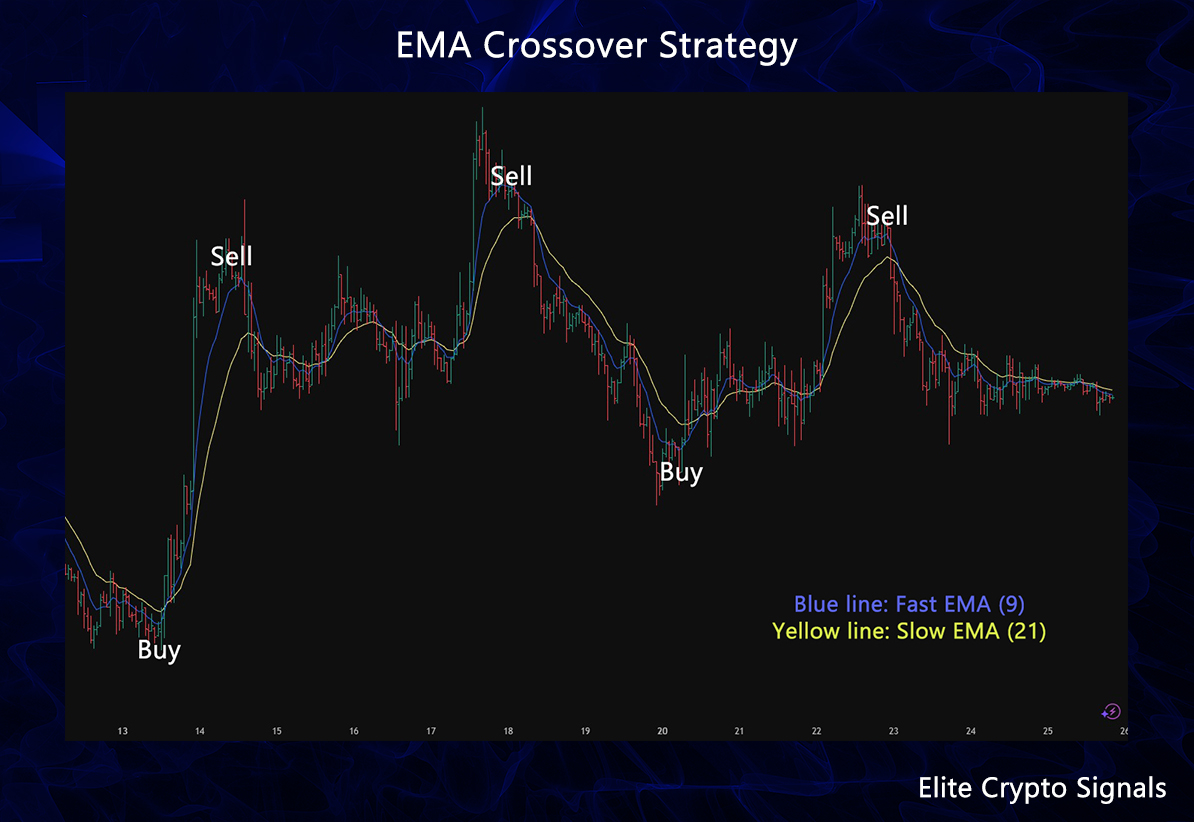
Easiest way to use a simple Moving average crossover strategy on Tradingview.
Select a chart, and then add two Exponential Moving Average indicators. Set the first for 9 (fast moving) and make it blue, then the other for 21 (slow moving) and set it for yellow. As you can see in the example image. When the blue line (Fast MA) closes above the yellow line (slow MA) that’s a clear sell indication. When it closes below it, that’s a clear buy indication.
Support and resistance levels
Moving averages are not only useful for identifying trends, but they also often serve as dynamic support or resistance levels.
When the price falls near a moving average in an uptrend, it often finds support there and then continues its upward movement. Similarly, in a downtrend, the moving average often acts as resistance: the price corrects up, but stops at the moving average and then turns down again.
This phenomenon arises from the fact that a wide range of market participants monitor moving averages and adjust their trading decisions accordingly.
For example, the 50-day and 200-day moving averages are a key reference for many investors, so their role as price support or resistance is often self-fulfilling. Thus, moving averages are not only technical indicators, but also psychological levels that can significantly influence market behavior.
To use this approach, go to Tradingview, and select a chart. Then add two Moving Average indicators. Go to settings, set the length of the first MA for 50, and the second MA for 200. Choose a color, e.g blue for 50 MA, and yellow for 200 MA. Now the blue line will act as a strong support level, and the yellow line as a major support level. It’s important that this only works if the market is in an uptrend or downtrend, and not in sideways market.

Trend identification
Moving averages provide a simple and extremely effective tool for identifying market trends. If the price is above the selected moving average, then we can talk about an upward trend. This means that the majority of market participants are in a buying mood and prices tend to move upwards in the long term. In such cases, the moving average can also act as a dynamic support along which the price is supported during corrections, thus confirming the upward trend.
Conversely, if the price is below the moving average, then we can talk about a downward trend. In this case, market participants tend to have a stronger selling tendency, and the price tends to move downwards in the longer term.
In this case, the moving average can act as a resistance, making it difficult for prices to rise during corrections. Such an examination of trends allows investors to quickly and clearly assess the market direction and effectively develop their trading strategies. The use of moving averages is therefore not only valuable from a technical analysis perspective, but is also relevant in terms of market psychology and investor behavior.
Related posts:
 Doji Patterns in Technical Analysis – The Ultimate Guide
 Bitcoin Liquidation Map – The Ultimate Guide
 Monero (XMR): Everything You Need to Know (2026)
 Crypto Slang – 10 Phrases You Should Know
 What is a digital credit, and why is it set to take off in 2026?
 Relative Strength Index: The Ultimate Guide for Beginners